

Organizational strain index (OSI)
Measures the overall pressure load experienced across teams and functions, identifying where strain concentrates and how it shifts .
Trajectory Enterprise delivers quantified, reliable shifts in how an organization absorbs pressure and converts it into performance. The data shows where the gap lives. The program closes it. The reassessments prove it.

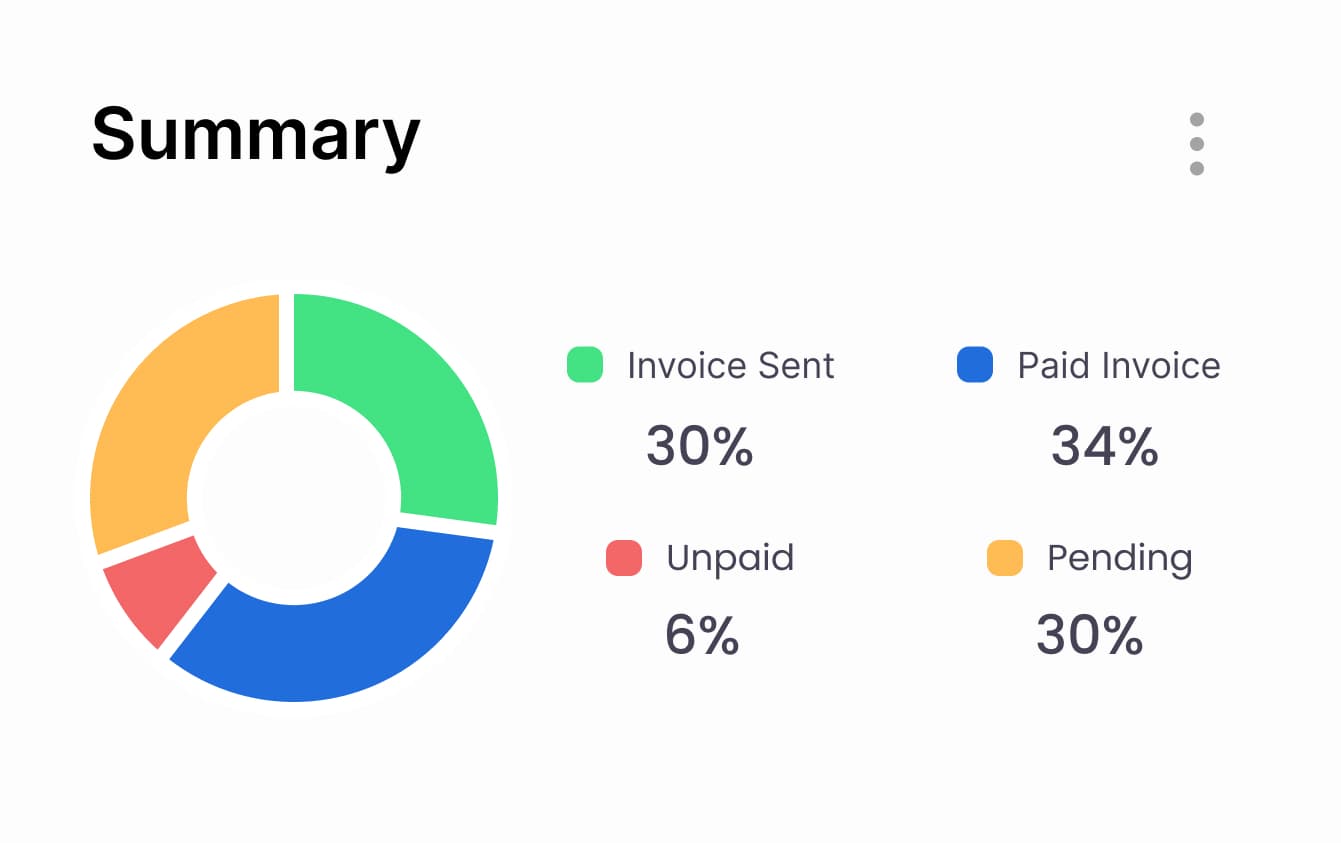

The Organizational Strain Index quantifies the strain your teams are feeling. Every engagement produces two full reassessments — at week 7 and at week 13 — so leadership can watch their own numbers move in real time, as a performance metric. That movement is what we track. That movement is what we are accountable to.
The following metrics represent the core signals tracked across every Trajectory Enterprise engagement. These indicators are continuously measured to reflect how organizational strain translates into performance outcomes over time
Measures the overall pressure load experienced across teams and functions, identifying where strain concentrates and how it shifts .

Tracks how quickly decisions move from discussion to execution, reflecting clarity of ownership and authority alignment.

Measures how effectively strategic priorities are converted into completed actions and delivered outcomes.

Evaluates the consistency between leadership intent and operational execution across teams and business units.
Five predictable outcomes that show up as the pressure system becomes visible and the structure begins to shift.

When the pressure profile is visible and named, leaders stop reacting to the wrong things. Agenda items shift. The urgent stops automatically winning.
Decision velocity returns. Authority gets clearer. Accountability becomes specific. The delay pattern that had quietly become the operating model begins to break.
Honest disagreement comes back. When people understand the pressure system they are inside, conversations shift from personal to structural. Engagement returns. Silence stops being the dominant mode.
Meetings become the place where real decisions happen. Excitement about meetings returns because prioritized objectives are actually progressed.

Client
“For the first time, we could actually see where pressure was forming instead of guessing. That visibility changed how leadership operated almost immediately. Decisions became faster, priorities clearer, and execution far more consistent across teams.”
“The OSI didn’t just measure strain — it changed the conversation inside leadership. What used to be interpreted as isolated performance issues became a connected system we could finally understand and act on.”
Every Trajectory Enterprise engagement maps each business unit on two axes: how severe the strain is, and how actionable the path forward is. That intersection clarifies urgency and creates decisioning.
Measures overall pressure levels across teams and tracks how strain shifts over time.
Tracks how quickly decisions move from discussion to execution with clear ownership.
Measures how effectively strategic priorities are converted into completed actions.
Tracks progress after interventions to evaluate organizational improvement and impact.
Trajectory Enterprise is not a workshop or advisory layer. It is a structured measurement system that connects leadership behavior, organizational strain, and execution outcomes into one continuous feedback loop.
The pressure your organization is carrying right now has a location. It has a severity score. It has a cost estimate. And it has a path forward. The only thing it does not have yet is a measurement.





Our clients describe measurable improvements in clarity, execution, and leadership alignment after reducing organizational strain through structured, data-driven transformation.
“We finally had a clear way to see where organizational pressure was forming and how it was affecting execution. That visibility changed leadership behavior quickly. Decisions became faster, priorities were clearer, and the organization started operating with far more alignment and consistency under pressure across multiple business units.”
Founder & Business Strategist
“The most significant shift was not just the measurement itself, but what it unlocked in leadership conversations. Once the OSI made strain visible, teams stopped reacting emotionally and started responding structurally. Meetings became focused, decisions accelerated, and accountability became far more precise across the organization.”
Visionary Enterprises
“We had strong performance metrics, but execution was inconsistent across teams. This framework exposed the exact points where strategy was breaking down in delivery. That clarity allowed leadership to intervene with precision, improving execution flow, reducing friction, and creating more reliable operational outcomes at scale.”
Operations Manager
“Once strain became measurable, everything changed in how leadership interpreted performance. What used to feel like isolated issues became a connected system. That shift created alignment across leadership layers, improved meeting effectiveness, and restored confidence in how decisions translated into execution under pressure.”
Financial Consultant