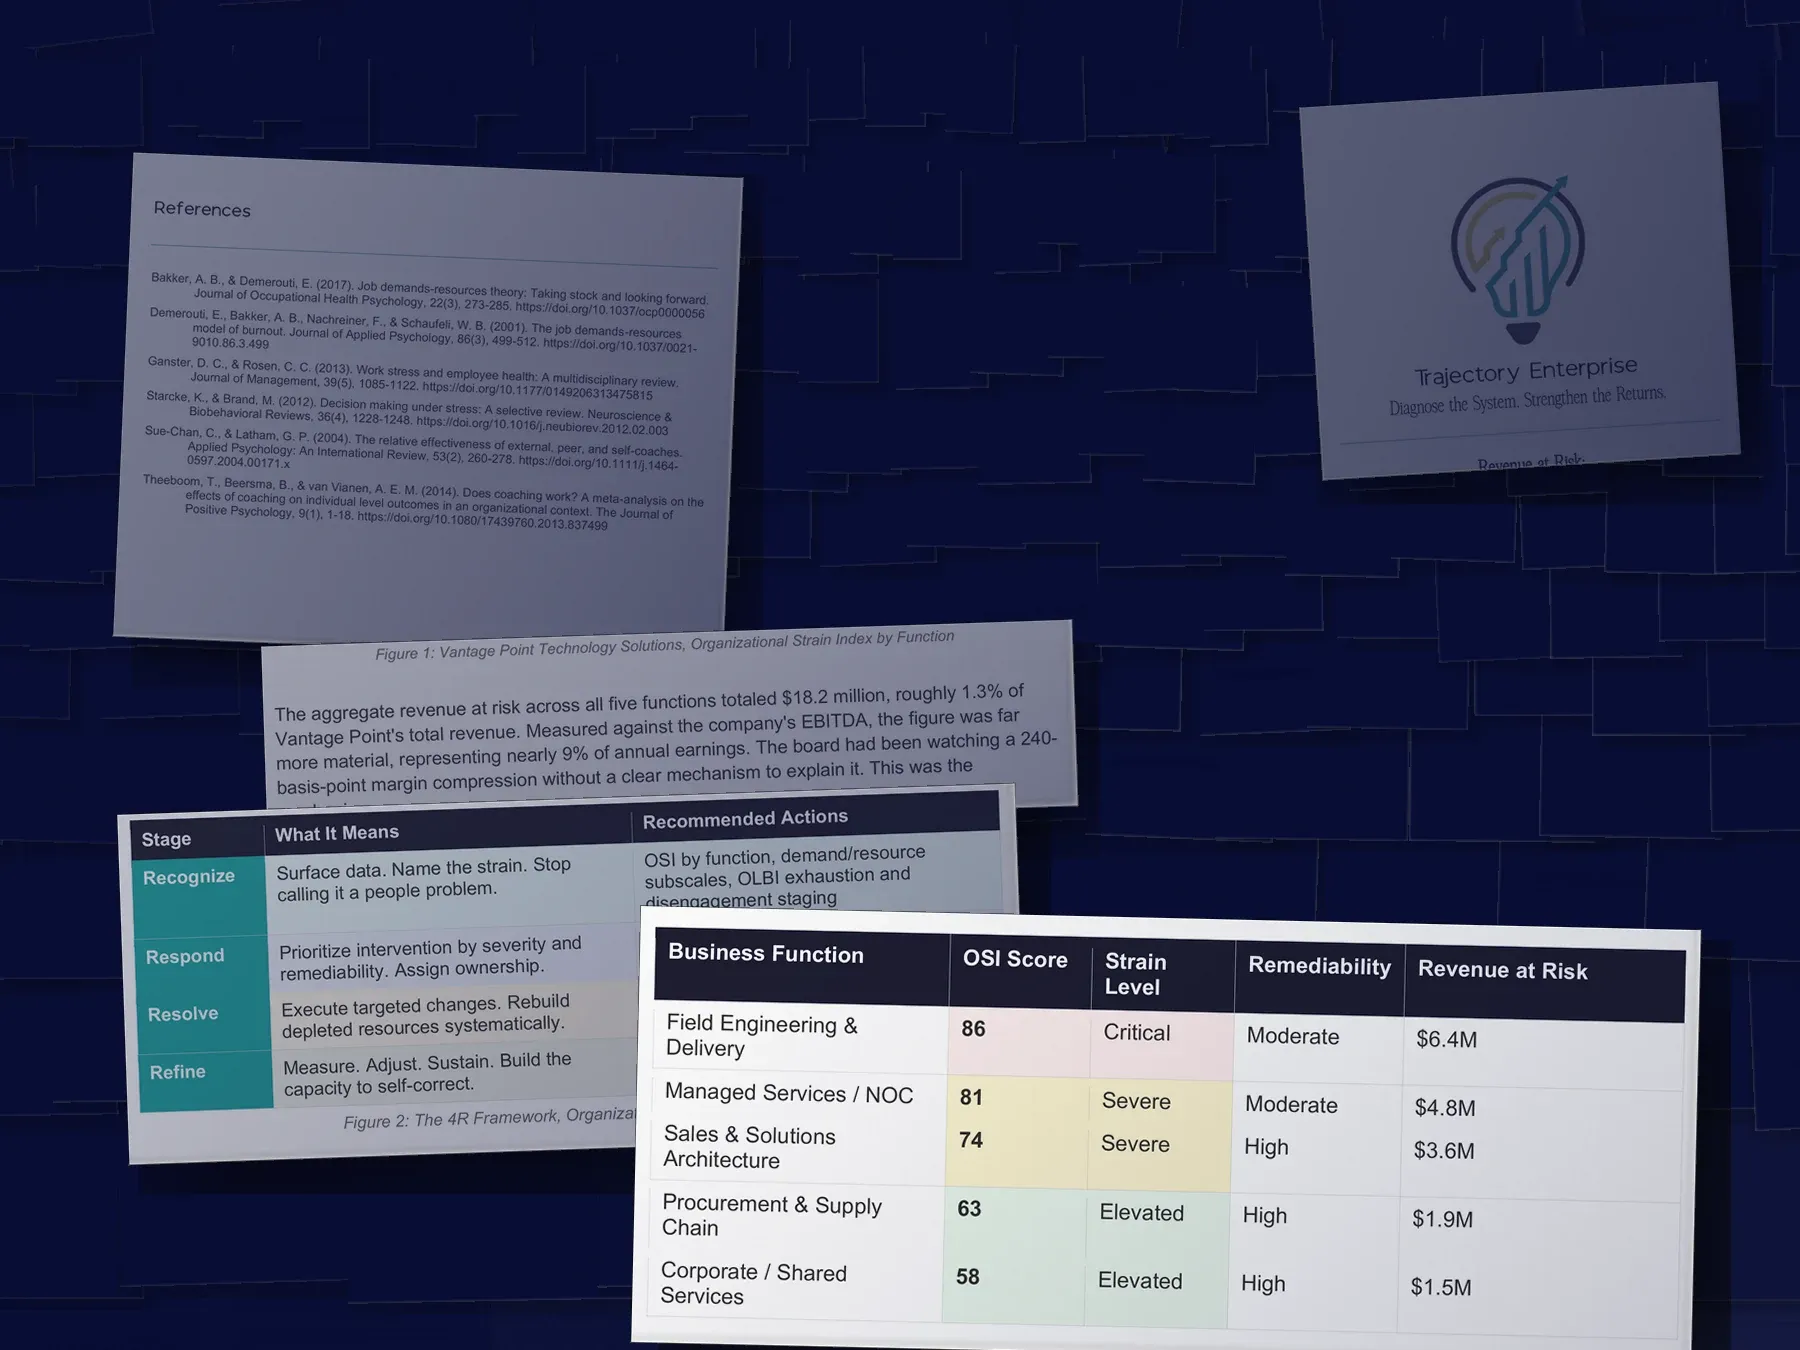
Pages of the Revenue at Risk research brief staged in a dark archive, mirrored from its sibling brief: the Organizational Strain Index scoring five business functions from 86 Critical to 58 Elevated against $6.4M to $1.5M of revenue at risk, the paragraph totalling the audit at $18.2 million, the 4R Framework table, the brief's reference list and its cover

18page research brief

  • Introduction: The Roll-Up That Worked, Until It Didn't
  • Part One: A Platform Built the Right Way, Carrying More Than It Shows
  • Part Two: What the Data Actually Showed
  • Part Three: From Diagnosis to Organizational Maturity
  • Part Four: The Case for Measuring Before You Restructure
Free Report

See What Organizational Strain Is Actually Costing Your Platform

Download the free 18-page research brief on measuring organizational strain across a multi-site technology solutions platform and translating it into dollars.

  • Why margin compression after an acquisition is usually a capacity problem, not a pricing one
  • The 5-function scorecard that turns organizational strain into a dollar figure
  • The 4-stage framework (Recognize, Respond, Resolve, Refine) for sequencing the fix
  • Two peer-reviewed reasons leadership teams can't fully see this themselves

No spam. Unsubscribe anytime.
What’s Inside

What you get

Everything below arrives the moment you submit your email. Nothing to schedule, nothing to wait on.

The 18-page research brief, Revenue at Risk, published by Trajectory Enterprise
A full walkthrough of the Trajectory Intelligence Assessment (TIA) methodology
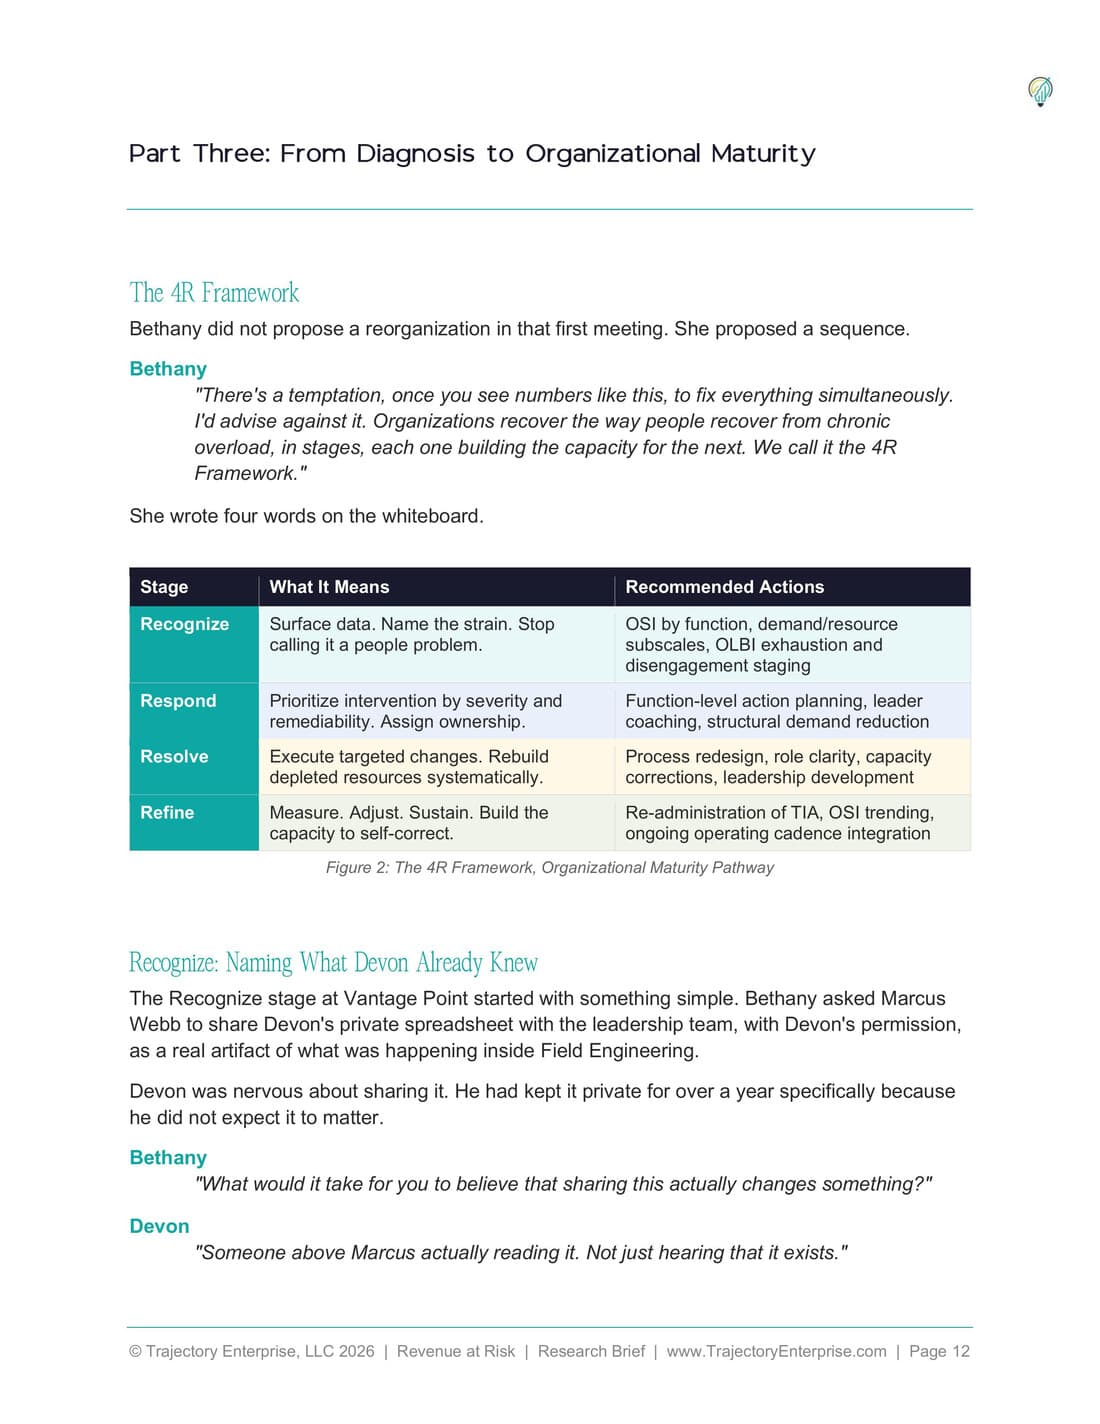
The 4R Framework table: Recognize, Respond, Resolve, Refine, with recommended actions per stage
The reference list of peer-reviewed sources behind the TIA's design

It's a research-backed way to see where organizational strain is concentrated across a multi-location platform before your next board conversation.

No spam. Unsubscribe anytime.
Inside the Report

A look at the real pages

This is what lands in your inbox the moment you submit, not a generic PDF wrapper.

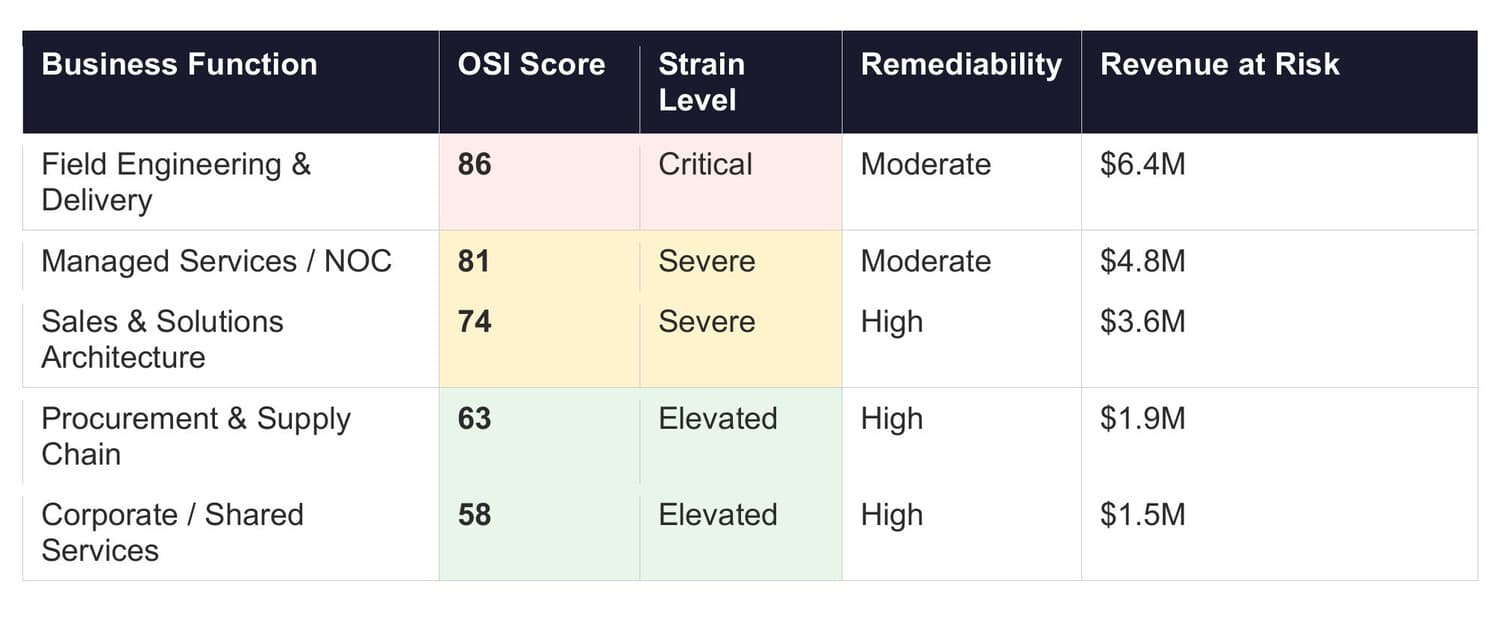
Figure 1 from Revenue at Risk: an Organizational Strain Index table scoring five business functions, from Field Engineering and Delivery at 86 (Critical) down to Corporate and Shared Services at 58 (Elevated), against remediability and revenue at risk of $6.4M to $1.5M
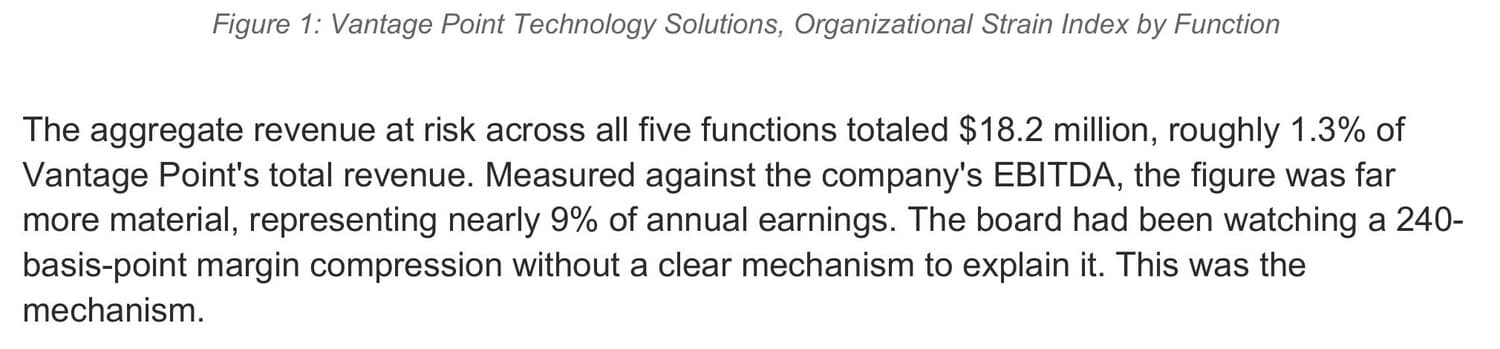
Passage from Revenue at Risk totalling the Organizational Strain Index table at $18.2 million of revenue at risk, roughly 1.3 percent of revenue and nearly 9 percent of annual earnings
Cover of the Revenue at Risk research brief from Trajectory Enterprise, 2026
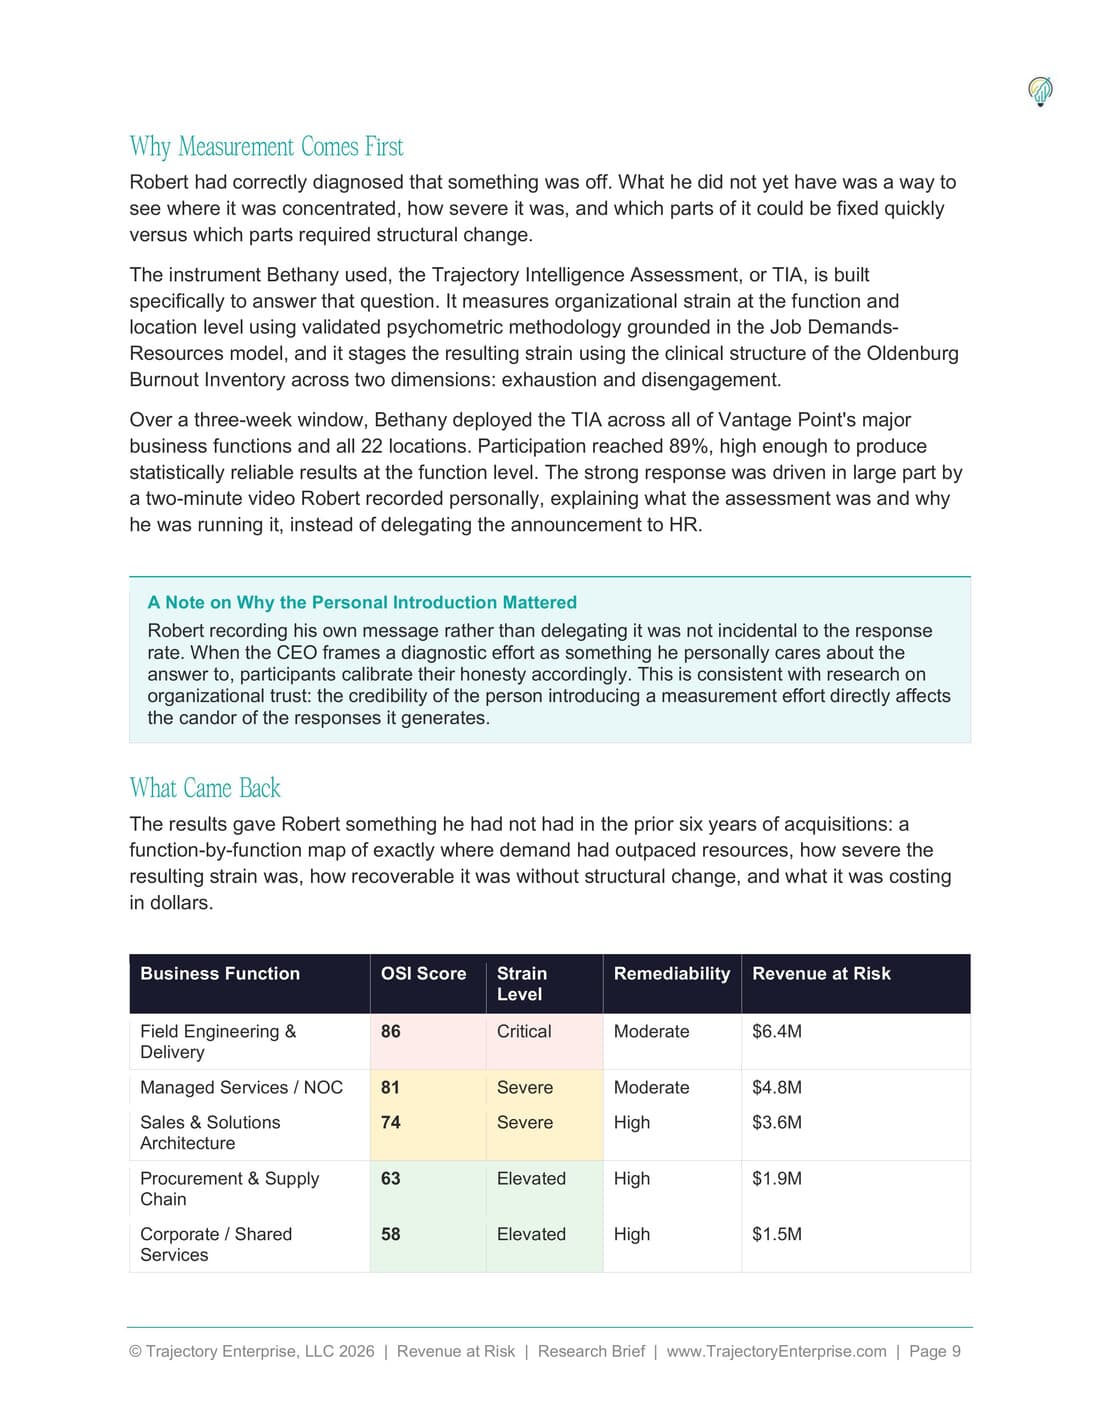
Page 9 of the Revenue at Risk research brief, carrying the Organizational Strain Index table by business function
Page 12 of the Revenue at Risk research brief, carrying the 4R Framework table
FOUNDERS

Built from two lenses of organizational reality

The research behind this report comes from the same two practitioners behind every Trajectory engagement.

Matt Wilhelmi MSIOP

Founder & CEO

Matt is a doctoral candidate in I-O Psychology at Illinois Institute of Technology and a fifteen-year veteran of M&A advisory and fractional CFO work. He has conducted approximately 40 buy-side diligence engagements and 5,000 business owner intake interviews — giving him an unusually granular view of how organizational strain converts to financial underperformance before it becomes visible in the data.

Amy Wilhelmi, PhD

Co-Founder & Chief Transformation Officer

Amy brings a clinical and research background to the challenge of organizational change. Her doctoral work focused on integrative therapeutic models and how sustained pressure reshapes behavior and capacity over time. She leads the design of Trajectory’s intervention architecture — ensuring that what the data reveals translates into a delivery experience that actually moves people.

See where your platform's organizational strain is concentrated

Enter your email and the report is yours immediately. No call, no sales conversation, just the download.

No spam. Unsubscribe anytime.