
The thesis was sound. The market was right. The management team had the résumés to back the growth plan. And eighteen months later, the numbers still came in short. Ask most operating partners what happened and the explanation usually lands on execution: the team moved too slowly, missed a hire, didn’t adapt fast enough. What rarely gets named is why execution slowed in the first place.
The Blind Spot in Standard 100-Day Plans
A typical 100-day plan is built around initiatives: systems to implement, roles to fill, processes to standardize. It answers what needs to happen. It rarely answers a quieter question that determines whether any of it happens on schedule: does this leadership team currently have the capacity to carry what the plan is about to ask of them.
Financial diligence tells a buyer whether the numbers are real. Commercial diligence tells a buyer whether the market opportunity is real. Neither one tells a buyer whether the organization sitting underneath the deal has room left to absorb a demanding value creation plan, or whether it is already running close to its limit before the ink on the deal is dry.
What Strain Looks Like Before It Shows Up in the P&L
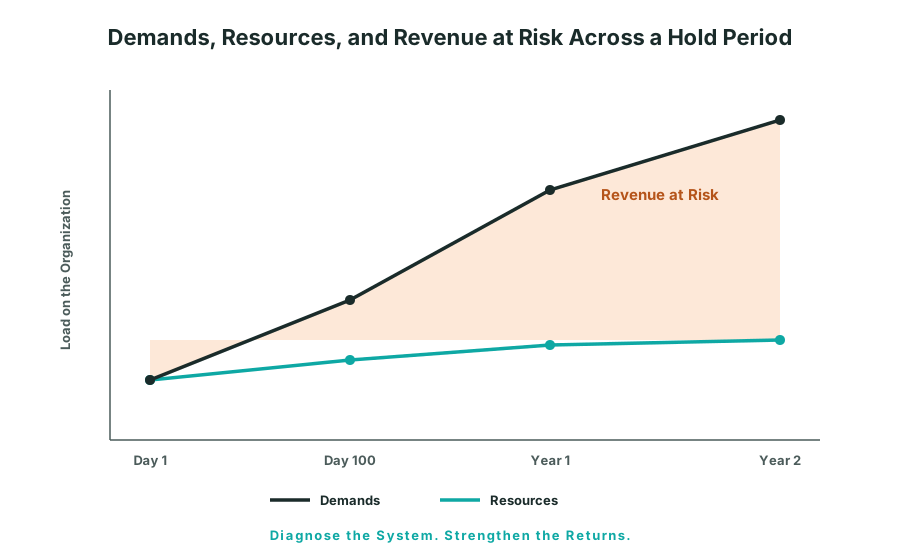
Organizational strain has a well-established structure in the research literature. The Job Demands-Resources model, developed by Demerouti, Bakker, Nachreiner, and Schaufeli (2001) and refined over the two decades since (Bakker & Demerouti, 2007), describes every role and every organization in terms of two forces: the demands placed on it and the resources available to meet those demands. When demands consistently outpace resources, strain builds. It does not build evenly, and it does not show up on a dashboard right away.
What it produces first is slower decisions, more rework, and leaders quietly absorbing load that should be distributed. Only later, once that strain has compounded, does it surface as missed targets, turnover in key roles, or a stalled initiative that never got the attention the plan assumed it would.
This progression matters because it means the P&L is a lagging indicator of leadership capacity, not a leading one. Alarcon’s (2011) meta-analysis, which reviewed 231 samples on the relationship between job demands, resources, and workplace attitudes, found demands to be a consistent and significant predictor of the kind of strain that eventually shows up as attrition and disengagement. In a portfolio company, that translates directly into missed milestones long before it shows up as a revised forecast.
Naming the Cost: Execution Drag and Commitment Drift
Two mechanisms tend to account for most of this gap between plan and delivery. The first, Execution Drag, is what happens when decision-making slows under strain, initiatives take longer than scoped, and leaders default to what is familiar instead of what the plan requires. The second, Commitment Drift, is what happens when key leaders start to disengage from the plan itself, still present, still capable, but no longer fully invested in seeing it through.
Neither shows up as a line item. Both show up as Revenue at Risk: the dollar value of a value creation plan that is technically sound but is being executed by a team that does not currently have the capacity to deliver it on the assumed timeline.
What Operating Partners Can Measure in Month One
This is not an argument for slowing down deal timelines. It is an argument for adding one more lens to the ones already in use. Bloom and Van Reenen’s (2010) research across thousands of firms found that management practices vary enormously, even within the same industry and even among similarly resourced companies, and that this variance is one of the more persistent predictors of firm performance. Ownership structure matters here too: their data found that private equity-owned firms tend, on average, to be better managed than family-owned or founder-led firms, but “on average” leaves considerable room for the individual portfolio company that is the exception.
The practical takeaway is that leadership capacity is not something that has to be inferred after the fact from missed targets. It can be measured directly, in the first 100 days, using the same framework Trajectory’s research is built on. Doing so gives an operating partner something a standard 100-day plan does not: an early view of which parts of the plan the current team can carry, and which parts will need additional resourcing before the timeline the model assumes is realistic.
Diagnose the system before it has a chance to quietly determine the return.
References
Alarcon, G. M. (2011). A meta-analysis of burnout with job demands, resources, and attitudes. Journal of Vocational Behavior, 79(2), 549-562.
Bakker, A. B., & Demerouti, E. (2007). The Job Demands-Resources model: State of the art. Journal of Managerial Psychology, 22(3), 309-328.
Bloom, N., & Van Reenen, J. (2010). Why do management practices differ across firms and countries? Journal of Economic Perspectives, 24(1), 203-224.
Demerouti, E., Bakker, A. B., Nachreiner, F., & Schaufeli, W. B. (2001). The job demands-resources model of burnout. Journal of Applied Psychology, 86(3), 499-512.